
Basic Biomechanical Concepts: The Foundation for Interpreting Local Load History Using Bone Histomorphology
1. The structural vs. material distinction.
A sound understanding of basic mechanical concepts is necessary for accurately assessing many of the issues that must be considered (Table 1) when interpreting a bone’s load history through the examination of its structural and material characteristics. For most studies of limb-bone adaptation, the following mechanical parameters are the most important to thoroughly understand: stiffness, strength, toughness, and fatigue resistance. These parameters are usually considered in terms of material properties, but to some degree can describe how well the whole bone can bear loads, which is measured via structural strength tests. Making the ‘structural vs. material distinction’ is important for understanding the importance or regional material (e.g., collagen orientation) variations between regions of the same bone. This is especially important because a bone’s structural requirements may have little to do with regional variations in its material/compositional requirements. In fact, as argued below, regional material variations (e.g., patterns of predominant collagen fiber orientation and osteon morphotypes) are relatively more useful than structural characteristics (e.g., a bone’s cross-sectional shape or variations in its cortical thickness) for interpreting the load history of a bone region.
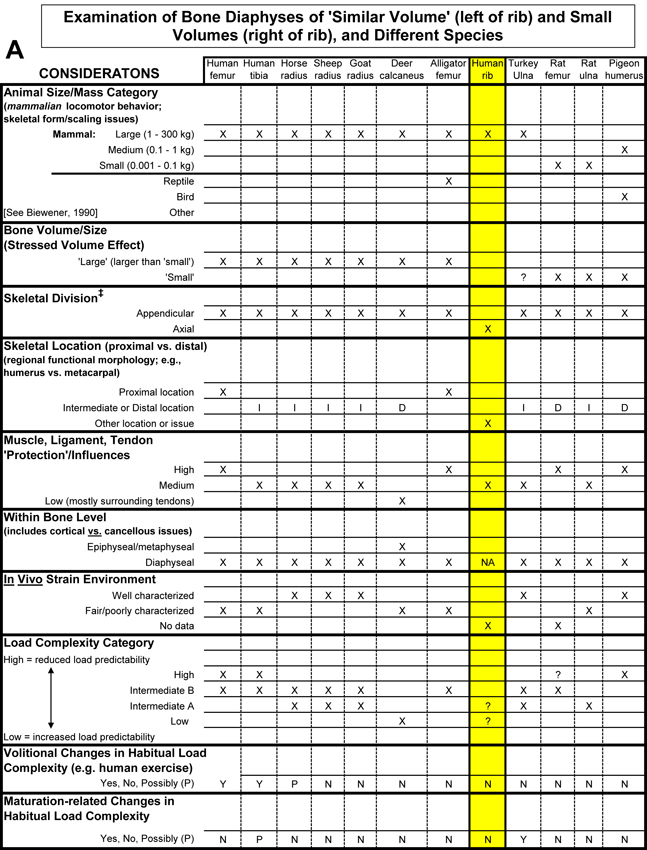
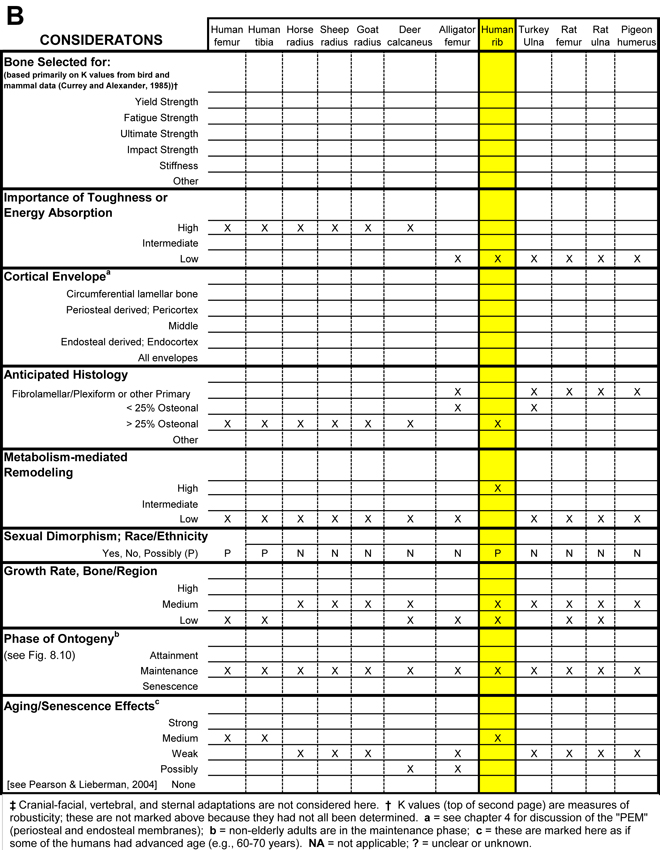
Table 1. Worksheet/checklist of important considerations for interpreting adaptation in the appendicular skeleton
2. Structural properties of bone
Much of the following paragraph is paraphrased from van der Meulen et al. (2001). In their study, these investigators generally more strongly subscribe to the idea of structural/material synergism/compensation than the view that is conveyed below in this section.
What is a whole-bone structural test and what does it measure? Different types of loads, such as bending or torsion, can be applied to whole bones in vitro to determine the structure’s stiffness and failure load (structural strength). The structural stiffness is a measure of the resistance to deformation under the applied load, and the structural strength is the load required to cause the whole bone to fail. These data are represented in a “load-deformation curve” (in contrast to the “stress-strain curve” of a material test). These two whole-bone measurements are structural properties and are influenced by both the material from which the structure is composed (the tissue material properties, see below) as well as how and where that material is distributed (the geometric form of the tissue). Therefore, both material and geometric properties are required to assess the structural integrity of a long bone, and neither material nor geometry alone is sufficient to predict the structural failure load. As emphasized by van der Meulen et al. (2001), there is currently no substitute for a mechanical test to measure whole-bone structural behavior; no alternative parameter has been identified that is fully indicative of strength and can serve as a surrogate measure.
Measures of diaphyseal shape and robusticity: Moments and axes of inertia.
Structural properties include features of a bone’s cross-sectional shape and robusticity (i.e., the amount and distribution of cortical area with respect to the total cross-sectional area) (Table 2). This includes the second moment of area, or inertia (I) as many also call it. The second moment of inertia helps describe the mechanical consequences of cross-sectional shape and mass distribution of a cross-section from a tubular structure such as the diaphysis of a long limb bone. Tubular structures have a larger moment of inertia both in bending and torsion than cylindrical structures with the same amount of mass (Fig. 1). The second moment of inertia is determined by integrating small units of area (δA) across the bone’s cross-section with respect to distances from its centroid: I = ∫(y2 δA). This is essentially a measure of how the material is distributed about a given axis.
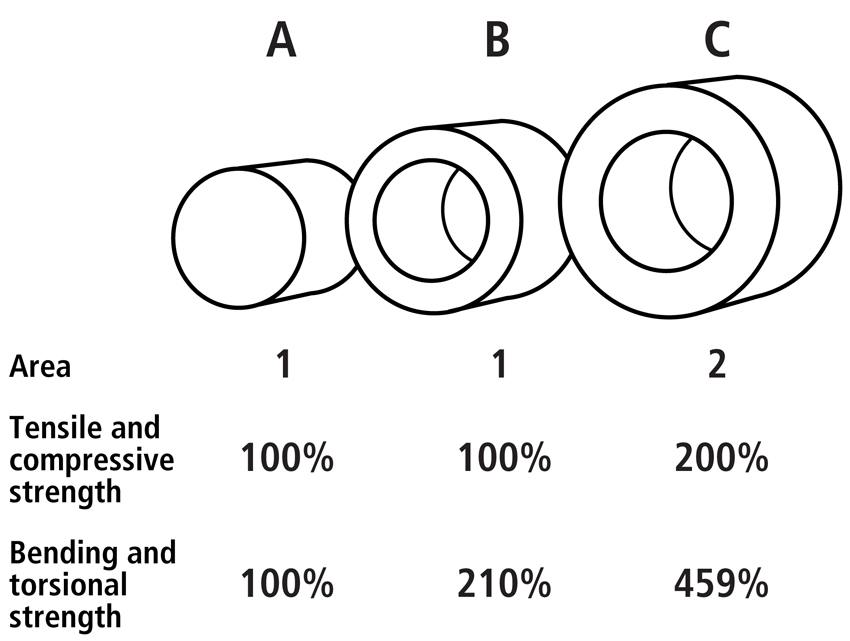
Fig. 1 Examples of the influence of cross-sectional geometry on the structural strength of three circular bars. Although bar A and B have the same area (1 square unit), bar B has a greater moment of inertia because it has a hollow interior and greater outer diameter. Bar C has twice the mass (or area in the cross-section; 2 square units) and therefore a much greater moment of inertia. Note that the cross-sectional areas of the bars are directly proportional to their tensile and compressive strengths. By contrast, because the moment of inertia is to the 4th power, the bending and torsional strengths become exponentially greater from bar A to C.
Table 2. Structural and material characteristics of a limb-bone diaphysis (reference : (Barth et al. 2010))
The axes of the second moment of inertia are measured in directions, which are typically considered in terms of: (1) the anatomical orientation of the cross-section (e.g., anterior-posterior Iy; medial-lateral Ix), and (2) the maximum or major (Imax or Imaj) and the minimum or minor (Imin) principal axes across which the distributions of mass are greatest and least, respectively (Fig. 2). Consequently, across the Imax and Imin axes are, respectively, the directions of greatest and least bending resistance (rigidity). The polar moment of the inertia (J) is proportional to the tubular structure’s torsional rigidity, which is estimated by summing the magnitudes of Imin and Imax (or other orthogonal moments; e.g., Iy + Ix).
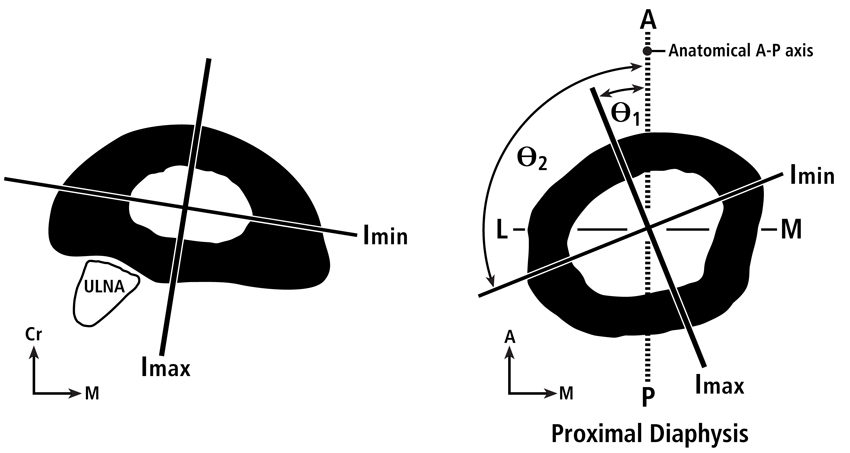
Fig. 2 A.(at left) Transverse cross-section at mid-diaphysis of a goat radius (Main 2007) showing the Imin and Imax axes. B.(at right) Transverse cross-section of an adult chimpanzee proximal femoral diaphysis showing the Imin and Imax axes. Also shown are the angles that these axes deviate from the anterior-posterior (AP) axis.
In the analysis of a bone’s cross-sectional cortical geometry, the sum of Imax and Imin (or Iy + Ix), therefore reflects bone robusticity where increases in robusticity are typically seen as greater percentages of cortical area with respect to the area of the entire cross-section. More specifically, the ratio of the principal cross-sectional moments (e.g., Imax/Imin) reflects the degree of “ellipiticality” or oblongation of the bone’s cross-sectional shape, while Iy/Ix reflects differences in its anterior-posterior/medial-lateral rigidity. Studies by Carlson and co-workers (Carlson, 2005; Carlson and Judex, 2007) provide good examples of how these measures of robusticity and ellipiticality are defined and used in anthropological studies that are aimed at deciphering load history. The units of these robusticity measures are to the fourth power, and this is why small changes in a bone’s outer diameter can have large effects on its bending and torsional rigidities (Fig. 1).
A good way to introduce the basic concepts of the axes and directions of the cross-sectional moments of inertia is to consider the analogy of a “two by four” wood plank commonly used in building homes. When considering the plank’s rectangular cross-section it is clear that it would be most difficult to bend it in the direction of the long dimension of the rectangle and easier to bend it along the short dimension. Hence, the direction of greatest bending resistance (see “DGBR” in Fig. 3) is along (in the direction of) the longer dimension and least along the narrower dimension. The problem with the nomenclature in terms of the “axes” of the moments of inertia is this: the minor or minimum axis (Imin) is along the long dimension of the rectangle and the major or maximum axis (Imax) is along the narrower dimension. If this nomenclature seems contradictory, then be aware that what is being referred to here are the “axes” of bending rigidity not the “directions” of the applied bending. Consider, for example, the “axis” of Imax, which is along the narrower direction of the wood plank’s cross-section. What this means is that the greatest bending rigidity occurs when the direction of bending is across (i.e., perpendicular to) the Imax axis, and bending rigidity is least when the direction of bending is across (i.e., perpendicular to) the Imin axis. These definitions can be confusing in the anthropological literature because some prominent investigators have adhered to them (e.g., Demes (2007)) while others have not (e.g., Ruff and Hayes (1983)). In the latter example, Ruff and Hayes take ”major axis” to mean the principal axis in the direction of greatest bending rigidity, not the axis across which bending rigidity is greatest.
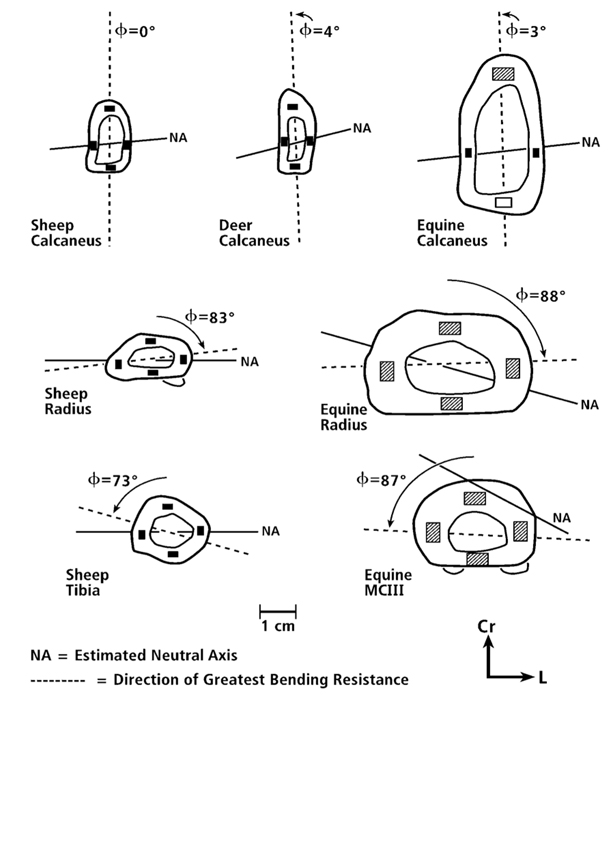
Fig. 3 Representative drawings of cross sections of “tension/compression” bones (simple load-complexity category) (at Top), and more complexly loaded bones (Middle and Bottom). The phi (Φ) angles are the acute angles formed by the direction of greatest bending resistance (DGBR) ( – – – – – ) and the sagittal plane (vertical orientation in each drawing) (DGBR is co-linear with axis of Imin, and 90º to axis of Imax). Small rectangles within the cortices are locations where nanostructural/microstructural analyses were conducted in our previous study (Skedros et al. 2009) and are the locations of the images shown in figure. In this chapter “anterior” and “posterior”, respectively, are used as surrogates for the anatomical locations of the opposing sagittal-plane cortices in the calcanei (dorsal and plantar) and radii (cranial and caudal). Cr = cranial = anterior; L = lateral.
3. Material properties of bone.
At the most basic level, bone is a composite of type 1 collagen and mineral (typically a carbonated hydroxyapatite), and this composite is enriched with non-collagenous proteins that also have important biochemical and biomechanical functions. Important mechanical and biophysical interactions of the collagen-mineral composite for elastic and plastic behaviors are described by Burstein et al. (1975), Skedros et al. (2006b), and Gupta et al (2008). Bone material properties are the tissue-level mechanical properties that describe the constituent material and are independent of the size and shape of the bone. These material properties are determined by machining precise samples from the bone of interest and testing them in a particular loading mode. With respect to material properties, it is important for all students of bone adaptation to memorize all features of a typical stress-strain curve, which shows the results of a material test (Fig. 4).
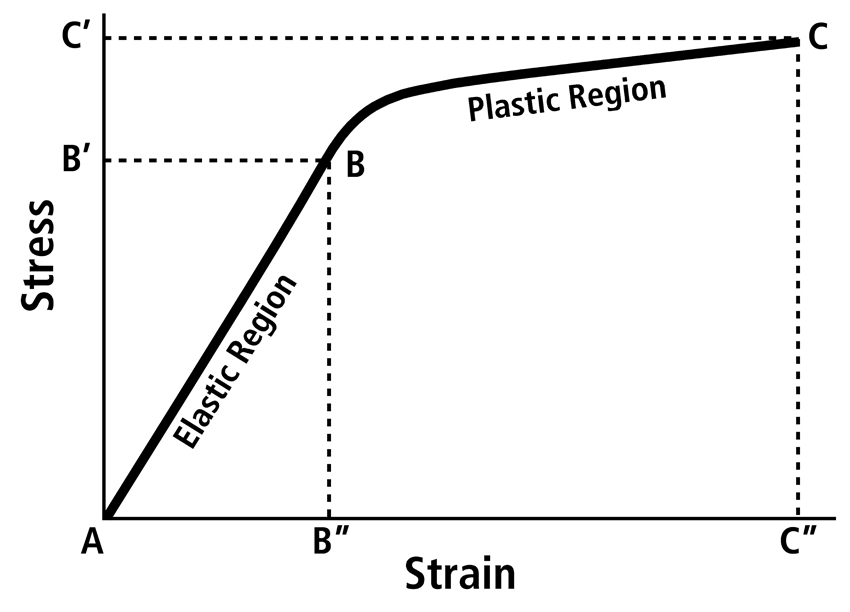
Fig. 4 A typical stress-strain curve obtained from a material test in tension (pulled). Beyond the yield point (B) is where permanent deformation of the specimen occurs. Yield stress (B’) is the load per unit area sustained by the specimen at the yield point, and yield strain (B”) is the amount of deformation withstood by the specimen before plastic deformation occurred. The strain at any point in the elastic region of the curve is proportional to the stress at that point. Therefore the slope of the elastic region (A-B) is the material stiffness or elastic modulus; increased steepness of the A-B slope represents increased stiffness. The ultimate failure point (C) is the point beyond which failure of the specimen occurred. Ultimate stress (C’) and strain (C”) are shown. The area A-B-B” is the elastic energy absorbed; the area B”-B-C-C” is the plastic energy absorbed. Total energy absorbed is a sum of elastic and plastic energy. Brittle materials have shorter B-C regions than more ductile materials (longer B-C regions).
The material properties are influenced by compositional measures such as mineral content (often expressed as “ash fraction”), predominant collagen fiber orientation (CFO), and osteon population densities. This material heterogeneity and its directionality (e.g., preferred orientation of osteons and/or collagen fibers) contribute to the material anisotropy of bone (Fig. 5). Bone tissue is also viscoelastic — it has stress-strain characteristics that are dependent upon the applied strain rate. In other words, a specimen of bone tissue that is exposed to very rapid loading will absorb more energy than a specimen that is loaded more slowly. Therefore, bone tissue is both anisotropic and viscoelastic. Because of these characteristics one must specify the strain rate and the direction of applied loading when discussing bone material behavior.
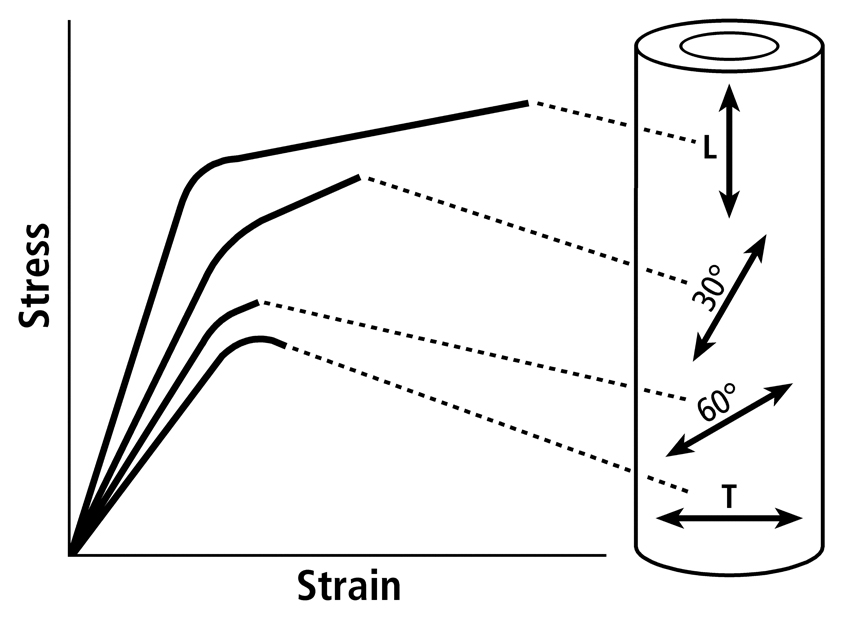
Fig. 5 Influence of tissue anisotropy on stress-strain curves using specimens obtained from a human femoral diaphysis and tested in tension (pulled). L = longitudinal (tested along the long axis of the bone); T = transverse (tested transverse to the long axis of the bone). The other tested directions are 30º and 60º to the long axis of the bone.
As noted, mechanical behaviors defined by stress and strain deal with material properties; the corollaries for structural properties are load and deformation, respectively. Stiffness and strength are the chief properties of a bone whether it is considered as a structure or as a material. The modulus of elasticity shows how stiff the bone material is. Yield stress (strength at initial failure) and strain determine how much energy can be absorbed before irreversible changes take place in the material. Ultimate stress is the strength at final failure.
Post-yield stress and strain 1 (see footnotes) determine mainly how much energy can be absorbed after yielding but before the material fractures (Fig. 6). Irreversible changes occur at the yield point and are caused by accumulating microdamage. The total area under the stress-strain curve is equivalent to the work that must be done per unit volume of the bone specimen before it breaks. For the purposes of this discussion, this “work” can be considered as being equivalent to “energy absorption” or “toughness”. All of these terms refer to the amount of energy required to fracture a material; the more overall energy consumed before failure, the ‘tougher’ the material (Zioupos and Currey, 1998) (see Appendix). The total area under the stress-strain curve can be divided into two portions: pre-yield energy absorption (elastic energy) and post-yield energy absorption (plastic energy) (Fig. 4). As described below, regional CFO variations typically correlate more strongly with energy absorption than with stiffness (elastic modulus) or strength (Skedros et al., 2006a). Fracture mechanical properties show the extent to which bone
Footnote 1. The three strain ‘modes’ are tension (pulled), compression, and shear. The highest strain ‘magnitudes’ are usually in compression (Lieberman et al., 2004). Among various stimuli, available data suggests that strain is the mechanical parameter most directly involved in causally mediating bone adaptations (Rubin and Lanyon, 1984; Lanyon, 1987; Ehrlich and Lanyon, 2002). Mechanical strain is the change in length of a loaded structure as a percentage of its initial (unloaded) length (Note: shear strain is not a change in length but a change in angle). This dimensionless ratio is a measure of material or tissue deformation. In vivo strain data from a variety of animals suggests that physiological strains are generally between 200 and 3,000 microstrain (i.e., between 0.02% and 0.30% change in length) in compression (Biewener et al., 1983a; Biewener et al., 1983b; Rubin and Lanyon, 1985). The upper limit may be only 1,500 microstrain in tension (Fritton et al., 2000). For an isotropic material loaded axially, stress and strain are related by Hooke’s law, which says that they are proportional to one another.
is resistant to crack initiation and to crack travel (which are different things and governed by somewhat different features). Crack travel resistance is indicated by post-yield stress and strain.
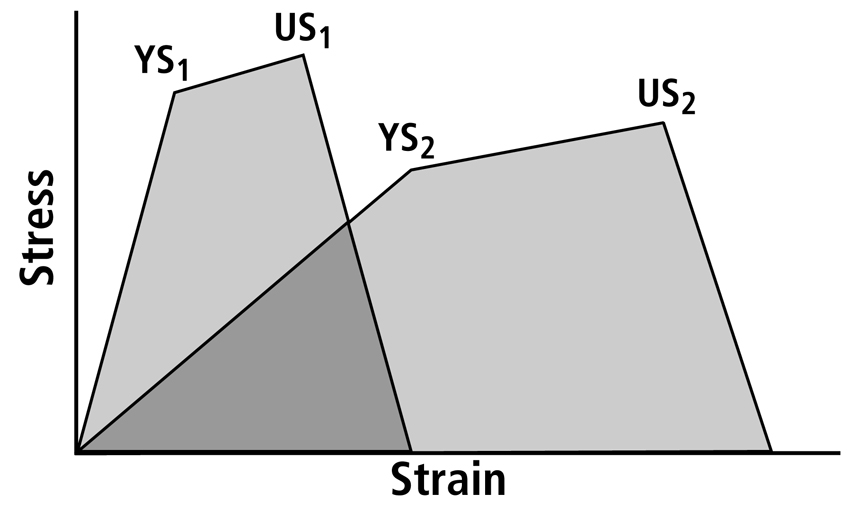
Fig. 6 Two stress-strain curves obtained from specimens with significantly different histocomposition. The more compliant material (at right) requires more energy to break it. Energy absorption is proportional to the area under each curve; hence the less compliant material (at left) absorbs less energy than the more compliant material even though it has higher yield stress (YS) and ultimate stress (US).
In addition to stiffness, strength, and toughness, fatigue resistance is one of the four most-important mechanical parameters that must be considered when interpreting the load history and adaptation of a bone or bone region. Fatigue failure is when a structure is loaded repeatedly and breaks at a lower load than would cause it to fail if it were loaded only once. Fatigue resistance is when fatigue failure is prolonged or avoided altogether. Nearly all of the material characteristics of bone that are listed in Table 2 have some bearing on a bone’s fatigue behavior. For detailed discussion of fatigue behavior, failure, and resistance in bone, readers are referred to Currey’s book (2002) and articles by R. Ritchie (Ritchie et al., 1993; Ritchie et al., 2005; Ritchie et al., 2008).
4. Using the stress-strain curve for considering mechanisms of bone adaptation produced by remodeling-induced affects on CFO, osteon morphotypes, and osteon population densities.
The final portion of this section is an exercise that considers how primary modifications for pre-yield (elastic) behavior can secondarily have beneficial consequences for post-yield behavior. This exercise helps to clarify why regional patterns of CFO and/or osteon morphotypes have cardinal importance for interpreting load history.
Consider this question: How does a bone achieve enhancements to its post-yield material properties when it would seem that natural selection would be at work in the pre-yield portion of the stress-strain curve (where bone tissue usually exists with regard to pre-fracture deformation throughout an animal’s life)? Another way to think about this is to ask: “How can material adjustments that appear to be aimed at enhancing behavior in the pre-yield portion of the stress-strain curve also improve post-yield behavior (Fig. 7A)?” Can this be accomplished through quasi independent natural selection for pre-yield vs. post-yield behavior, or is post-yield behavior simply a consequence of the inherent material properties of bone (which seems to be the case in deer antler where secondary osteons are scarce (Krauss et al., 2009; Krauss et al., 2011; Gomez et al., 2013; Skedros et al., 2014).
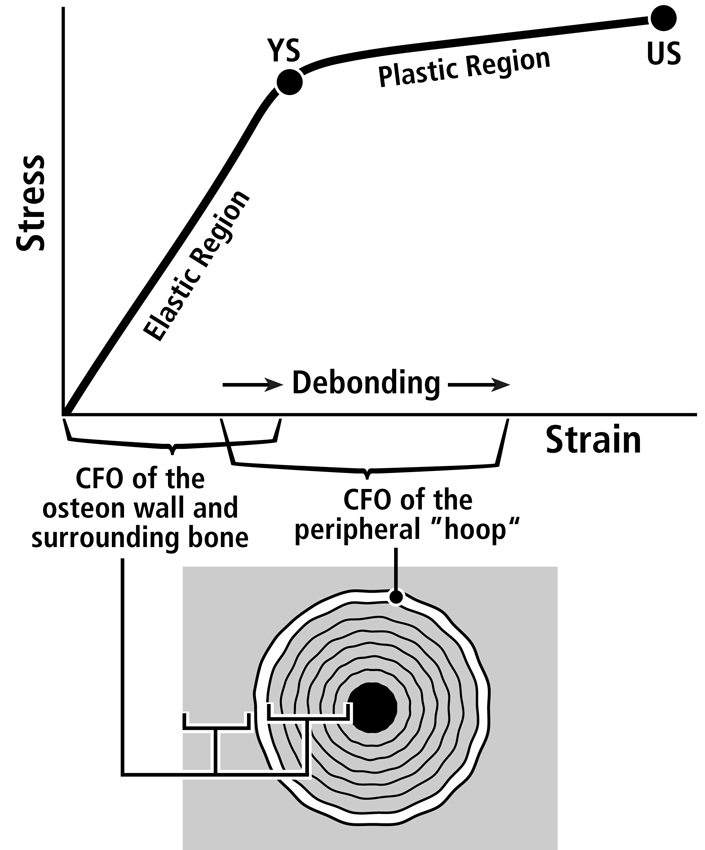
Fig. 7 A. Stress-strain curve of a tension test that shows the hypothesis that the longitudinal collagen that forms the majority of the wall in “tension” osteons helps to satisfy the material requirements of the bone-mineral composite for elastic behavior by curbing excessive strains in order to avoid irreversible damage. The oblique-to-transverse collagen fiber orientation (CFO) of the peripheral lamellae (“hoops”) of these osteons (see Figs. 9 and 10) allow for debonding at the cement line in a quasi controlled fashion as the yield point (YS) is approached, and this can continue beyond this point into the initial portion of the plastic region (between YS and US). This “beneficial” debonding dissipates energy that helps to avoid reaching the US point where fracture then occurs. This depiction is based on data and observations described by Bigley et al. (2006), Martin et al. (1998) and Williams et al. (2010).
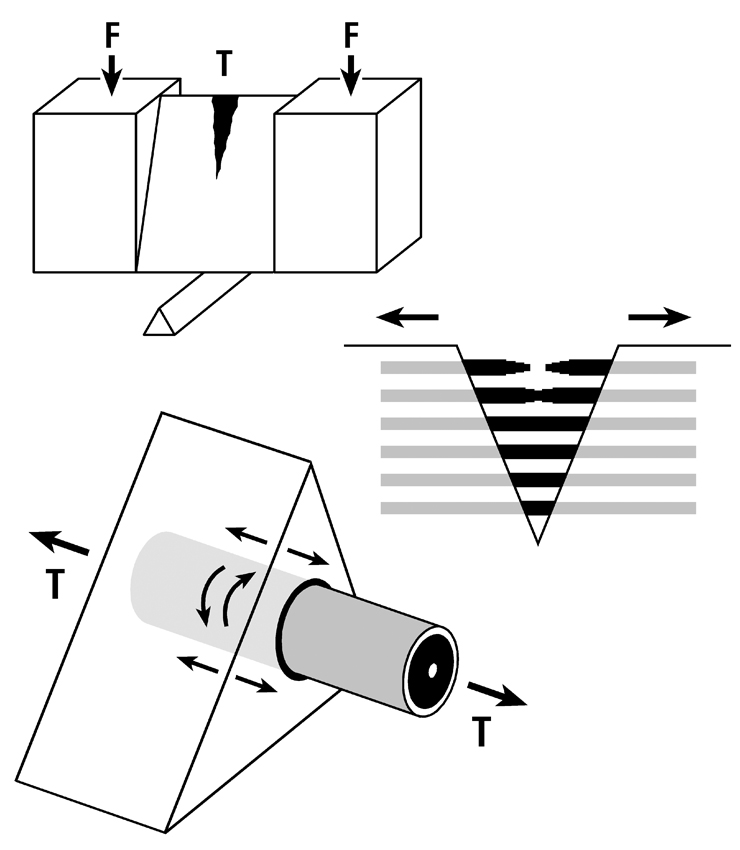
Fig. 7B. Three drawings depicting an energy absorption (toughness) test in tension (T) of a machined specimen (at top) loaded at each end with a force (F). Energy is absorbed as the osteons debond, pullout, and bridge the forming crack (middle drawing). Osteon morphotypes that appear to be adapted to accommodate habitual tension and resist tension overload have a peripheral lamella with highly oblique/transverse collagen (“hoop”) that probably also absorbs energy by resisting shear stresses (curved lines in lower drawing) during debonding and pull out. (Adapted from Martin et al. (1998))
Three important facts that help to answer these questions are: (1) remodeling can be activated by bone microdamage that naturally occurs in the pre-yield phase (Reilly, 2000) (tough materials allow some microdamage formation as long as these microdamage entities do not propagate much), (2) remodeling can probably be activated by strains that are greatly amplified at the osteocyte level but may not have caused classical microdamage (e.g., microcracks), and (3) osteonal interfacial debonding (e.g., at the cement line) can be a “good thing” because it allows for the dissipation of energy, which helps to avoid ultimate failure (Reilly et al., 1997; Hiller et al., 2003; Bigley et al., 2006; Herman et al., 2010) (Fig. 7B). Adaptations that enhance the bone tissue performance that are triggered by microdamage (an “extra-genetic” factor, Fig. 8) and are most readily subject to natural selection, can include the formation of strain-mode-specific osteon morphotypes and/or modeling-mediated adjustments in bone nanostructure/microstructure (e.g., interfaces and bonding characteristics associated with patterns of predominant CFO, and/or patterns of vascular anatomy and their associated histological interfaces) (Skedros, 2012). These can be thought of as “primary adaptations”; namely, those that are primarily aimed at enhancing pre-yield behavior. These primary adaptations can have beneficial (perhaps serendipitous) effects for post-yield behavior. In turn, even though the plastic phase is not often experienced, the possibility that strains would become high enough to enter this phase must be anticipated (or “pre-adapted”) so that failure is not rapidly catastrophic. From this perspective, it is plausible that the differences in “tension” osteon morphotypes (e.g., the degree of the completeness of the peripheral bright “hoop”) (Figs. 9 and 10) could help enhance ‘beneficial’ debonding when post-yield strains are experienced. By contrast, the majority of the wall of “tension” osteon morphotypes (i.e., the longitudinal collagen fibers) accommodates the requirements for pre-yield behavior, which is where the usual/typical loading occurs (Fig. 7). Osteon size might also play a role in this context (Hiller et al., 2003; Bigley et al., 2006), and could be linked to osteon morphotype (e.g., larger osteons having brighter and more complete peripheral “hoops”). This coupled pre-yield/post-yield adaptation hypothesis is currently under investigation in order to better understand how a bone’s nanostructural and microstructural properties contribute to its toughness across the pre-yield/post-yield transition (Skedros, 2012; Skedros et al., 2013).
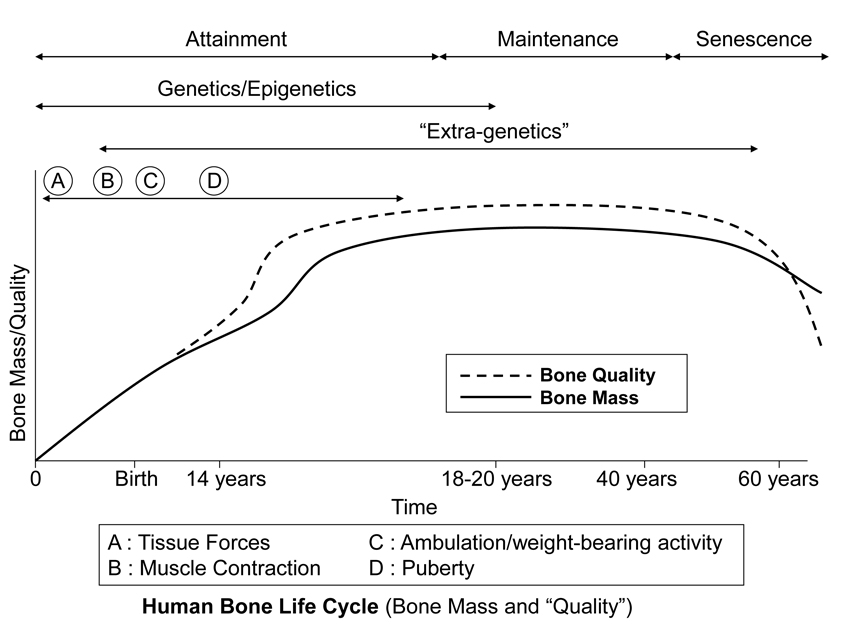
Fig. 8 This stylized depiction of ontogenetic changes in bone mass and “quality” (e.g., bone tissue mechanical properties) in humans and is adapted from several sources (Biewener and Bertram 1993; Carter and Beaupré 2001; Kassem et al. 1996). This figure helps to conceptualize the putative shifts in the temporal importance of genetic, epigenetic, and extra-genetic influences, especially with respect to varying histocompositional characteristics within or between bones. In this context, for example, the regional material variations that emerge in the “tension” and “compression” cortices during mid-to-late phases of growth of horse radii (Riggs et al. 1993) and sheep calcanei may serve to enhance the toughness and fatigue resistance for these habitual non-uniform strain environments. From the pre-natal phase and well into the attainment phase, the adaptive growth response of cartilage, or chondral modeling (not discussed in this chapter), has a profound influence on the growth and form of limb bones, especially at their epiphyses where articulations are formed with adjacent bones (Hammond et al. 2010). Shown is also the second bone mass growth spurt that occurs in humans, which has not been demonstrated in any other amniote.
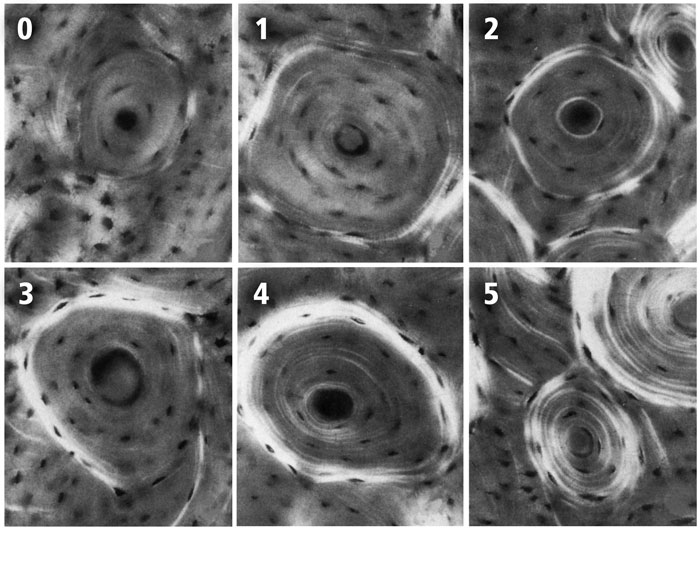
Fig. 9 The six-point scoring scheme with examples of each osteon birefringence pattern (osteon “morphotype”). These images are reproduced from the original study of Martin et al. (1996b). The numerical values of each of the six morphotypes are used to calculate the osteon morphotype score (MTS) of entire microscopic images that contain many osteons (Skedros et al. 2009). Four of the six numerical scores shown include consideration of the completeness and birefringence strength (brightness) of the peripheral ring “O” or hoop:
0 = category N, a dark osteon with no birefringent lamellae;
1 = category OWI, a combination of OI and OW;
2 = category OW, similar to O but the birefringent ring is weak (W);
3 = category OI, similar to O but the birefringent peripheral ring is incomplete (I);
4 = category O osteon with dark interior and strongly birefringent peripheral lamellae;
5 = category D, birefringent lamellae are distributed throughout the wall of the osteon (“distributed” osteon group). This group includes “bright” osteons (less frequent) and “alternating” osteons (more frequent).
(Images are reproduced from Martin et al. (1996a) with permission of Elsevier Science, Inc.)
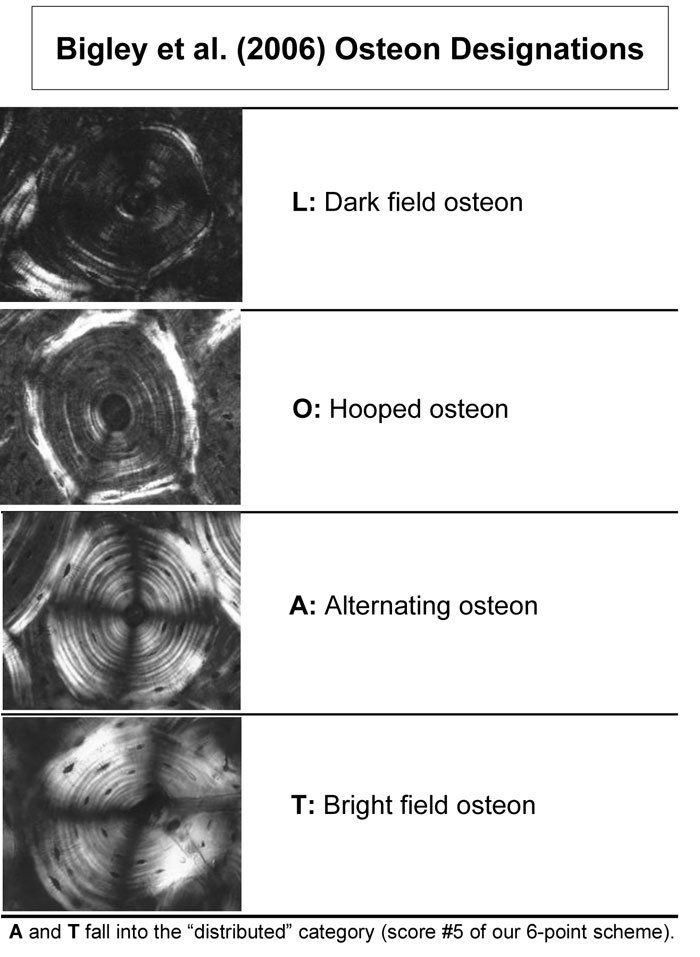
Fig. 10 Examples of the osteon morphotypes that were analyzed in pushout tests by Bigley et al. (2006).
(Images are reproduced with permission granted by Lanny Griffin and Elsevier Ltd., Oxford, UK.)
The biomechanical concepts highlighted by this exercise provide the factual basis for how and why osteon morphotypes and/or predominant CFO are often the most important of many characteristics that must be assessed when interpreting the load history of the bone or bone region.
Appendix: Definitions
Anisotropy: This refers to a material with a grain whose properties or technical constants are different when measured in different directions, most having some degree of symmetry to their internal structure. Bone is anisotropic, but examples of limited anisotropy can also be found in bone (orthotropic and transversely isotropic) (Martin et al., 1998; Currey, 2002). If the properties are the same in different directions, then the material is isotropic.
Adaptation:Adaptation in cortical bone commonly refers to either: (1) changes in bone structure and/or material organization in response to loading conditions outside a normal physiologic stress/strain range, distribution, and/or duration etc. (Schaffler et al., 1985; Martin and Burr, 1989), or (2) the presence of regional differences in structural and/or material organization that are strongly influenced by normal functional stimuli occurring during normal development within or between bones (Martin and Burr, 1989; Bertram and Swartz, 1991; Riggs et al., 1993). In this section, and for most “Team Bone” research projects, the use of the term adaptation is not meant to imply an evolutionary adaptation within a species, but rather a specific adaptation within the lifetime of an individual. In other words, “adaptations” are considered to be biomechanically relevant regional variations and temporal changes in cortical bone structural and material organization that are produced by the modeling and remodeling processes during normal skeletal development. In addition to being mediated by genetic and epigenetic influences, which are heritable, these processes can be influenced by non-heritable (“extra-genetic”) stimuli such as regional variations in microdamage incidence.
This section primarily deals with identifying correlations between structure, material, function, and load history. These correlations might be produced by: (1) adaptation via natural selection, and (2) accommodation via epigenetic events. We have suggested that the non-uniform strain distribution experienced in the early development of most limb bones is proximate to the historical origin (i.e., mechanistic/causal) of the structure-function relationship (Skedros et al., 2007). Therefore, the word “adaptation” in some Team Bone published papers, this context is deemed appropriate sensu stricto. Although the word “accommodation” is also used in this chapter, some readers might argue that this is inappropriate because in most cases where it is used there has been no attempt to see how affecting the epigenetic signals that influence bone development would change structure or material (like Starck and Chinsamy, 2002).
Fatigue resistance: Fatigue resistance is when fatigue failure is prolonged or avoided altogether. Fatigue failure is when a structure is loaded repeatedly and breaks at a load that would not cause it to fail if it were loaded only once. Fatigue behavior, failure, and resistance are complex topics that would require several textbook chapters to adequately address; readers are referred to Currey’s book (2002) for detailed discussion.
Modeling: Modeling activities affect the formation and/or resorption of secondary or non-secondary bone (e.g., primary bone, and trabecular bone in some cases) on periosteal or endosteal surfaces. They are detected as changes and/or differences in a bone’s curvature, cross-sectional shape and/or regional cortical thickness. Consequently, modeling is a concept describing a combination of non-proximate, though coordinated, resorption and formation drifts whose net result is, typically, to change the distribution of bone. Such drifts are called macro-modeling in cortical bone and mini-modeling in cancellous bone. The re-alignment of trabecular tracts along the lines of stress would be a consequence of mini-modeling.
Remodeling: Remodeling activities affect the replacement of intracortical bone; this is achieved through the activation of basic multicellular units (BMUs = osteoclasts and osteoblasts) that create secondary osteons (Haversian systems) in cortical bone and secondary osteons or hemi-osteons in trabecular bone (Jee et al., 1991; Parfitt et al., 1996).
Toughness: Toughness refers to the amount of energy required to fracture a material; the more the overall amount of energy consumed, the ‘tougher’ the material (Zioupos and Currey, 1998). Tough materials resist damage propagation but do not necessarily resist damage formation. Toughness tests typically involve propagating a crack in a controlled direction through a specimen machined into a specific shape for this test. Toughness measurements obtained from these ‘formal’ toughness tests are different from the ‘toughness’ that is often ‘informally’ used to describe the energy absorbed by a specimen during a more conventional failure test. In this case, energy absorption is measured as the area under the stress/strain curve (Turner and Burr, 1993), which is an indirect measure of propagation toughness (Vashishth, 2004).
References
Barth HD, Launey ME, Macdowell AA, Ager JW, 3rd, Ritchie RO. 2010. On the effect of X-ray irradiation on the deformation and fracture behavior of human cortical bone. Bone 46:1475-1485.
Bertram JE, Swartz SM. 1991. The ‘law of bone transformation’: a case of crying Wolff? Biol Rev Camb Philos Soc 66:245-273.
Biewener AA, Bertram JEA. 1993. Mechanical loading and bone growth in vivo. In: Hall BK, editor. Bone, Volume 7, Bone Growth – B. Boca Raton, FL: CRC Press. p 1-36.
Biewener AA, Thomason J, Goodship A, Lanyon LE. 1983a. Bone stress in the horse forelimb during locomotion at different gaits: A comparison of two experimental methods. J Biomech 16:565-576.
Biewener AA, Thomason J, Lanyon LE. 1983b. Mechanics of locomotion and jumping in the forelimb of the horse (Equus): In vivo stress developed in the radius and metacarpus. J. Zool. Lond. 201:67-82.
Bigley RF, Griffin LV, Christensen L, Vandenbosch R. 2006. Osteonal interfacial strength and histomorphometry of equine cortical bone. J Biomech 39:1629-1640.
Burstein AH, Zika JM, Heiple KG, Klein L. 1975. Contribution of collagen and mineral to the elastic-plastic properties of bone. J Bone Joint Surg Am 57:956-961.
Carlson KJ. 2005. Investigating the form-function interface in African apes: Relationships between principal moments of area and positional behaviors in femoral and humeral diaphyses. Am J Phys Anthropol 127:312-334.
Carlson KJ, Judex S. 2007. Increased non-linear locomotion alters diaphyseal bone shape. J Exp Biol 210:3117-3125.
Carter DH, Beaupré GS. 2001. Skeletal function and form. Mechanobiology of skeletal development, aging, and regeneration. Cambridge, UK: University of Cambridge.
Currey JD. 2002. Bones: Structure and Mechanics. Princeton, NJ: Princeton University Press.
Demes B. 2007. In vivo bone strain and bone functional adaptation. Am J Phys Anthropol 133:717-722.
Ehrlich PJ, Lanyon LE. 2002. Mechanical strain and bone cell function: a review. Osteoporos Int 13:688-700.
Fritton SP, McLeod KJ, Rubin CT. 2000. Quantifying the strain history of bone: Spatial uniformity and self-similarity of low-magnitude strains. J. Biomech. 33:317-325.
Gomez S, Garcia AJ, Luna S, Kierdorf U, Kierdorf H, Gallego L, Landete-Castillejos T. 2013. Labeling studies on cortical bone formation in the antlers of red deer (Cervus elaphus). Bone 52:506-515.
Gupta HS, Zioupos P. 2008. Fracture of bone tissue: The ‘hows’ and the ‘whys’. Med Eng Phys 30:1209-1226.
Hammond AS, Ning J, Ward CV, Ravosa MJ. 2010. Mammalian limb loading and chondral modeling during ontogeny. Anat Rec (Hoboken) 293:658-670.
Herman BC, Cardoso L, Majeska RJ, Jepsen KJ, Schaffler MB. 2010. Activation of bone remodeling after fatigue: differential response to linear microcracks and diffuse damage. Bone 47:766-772.
Hiller LP, Stover SM, Gibson VA, Gibeling JC, Prater CS, Hazelwood SJ, Yeh OC, Martin RB. 2003. Osteon pullout in the equine third metacarpal bone: Effects of ex vivo fatigue. J Orthop Res 21:481-488.
Jee WSS, Li XJ, Ke HZ. 1991. The skeletal adaptation to mechanical usage in the rat. Cells and Materials 1:131-142.
Kassem M, Melton LJ, Riggs BL. 1996. The Type I Type II mode for involutional osteoporosis. In: Marcus R, Feldman D,
Kelsay J, editors. Osteoporosis. New York: Academic Press. p 691-702.
Krauss S, Fratzl P, Seto J, Currey JD, Estevez JA, Funari SS, Gupta HS. 2009. Inhomogeneous fibril stretching in antler starts after macroscopic yielding: indication for a nanoscale toughening mechanism. Bone 44:1105-1110.
Krauss S, Wagermaier W, Estevez JA, Currey JD, Fratzl P. 2011. Tubular frameworks guiding orderly bone formation in the antler of the red deer (Cervus elaphus). J Struct Biol 175:457-464.
Lanyon LE. 1987. Functional strain in bone tissue as an objective, and controlling stimulus for adaptive bone remodelling. J Biomech 20:1083-1093.
Lieberman DE, Polk JD, Demes B. 2004. Predicting long bone loading from cross-sectional geometry. Am J Phys Anthropol 123:156-171.
Main RP. 2007. Ontogenetic relationships between in vivo strain environment, bone histomorphometry and growth in the goat radius. J Anat 210:272-293.
Martin RB, Burr DB. 1989. Structure, function and adaptation of compact bone. New York: Raven Press.
Martin RB, Burr DB, Sharkey NA. 1998. Skeletal Tissue Mechanics. New York, NY: Springer-Verlag.
Martin RB, Gibson VA, Stover SM, Gibeling JC, Griffin LV. 1996a. Osteon structure in the equine third metacarpus. Bone 19:165-171.
Martin RB, Gibson VA, Stover SM, Gibeling JC, Griffin LV. 1996b. Osteonal structure in the equine third metacarpus. Bone 19:165-171.
Parfitt AM, Mundy GR, Roodman GD, Hughes DE, Boyce BF. 1996. A new model for the regulation of bone resorption, with particular reference to the effects of bisphosphonates. J Bone Miner Res 11:150-159.
Reilly GC. 2000. Observations of microdamage around osteocyte lacunae in bone. J. Biomech. 33:1131-1134.
Reilly GC, Currey JD, Goodship AE. 1997. Exercise of young thoroughbred horses increases impact strength of the third metacarpal bone. J Orthop Res 15:862-868.
Riggs CM, Lanyon LE, Boyde A. 1993. Functional associations between collagen fibre orientation and locomotor strain direction in cortical bone of the equine radius. Anat Embryol 187:231-238.
Ritchie RO, Cannon RM, Dalgleish BJ, Dauskardt RH, McNaney JM. 1993. Mechanics and mechanisms of crack growth at or near ceramic-metal interfaces: interface engineering strategies for promoting toughness. Materials Science and Engineering: A 166:221-235.
Ritchie RO, Kinney JH, Kruzic JJ, Nalla RK. 2005. A fracture mechanics and mechanistic approach to the failure of cortical bone. Fatigue Fract Eng Mater Struct 28:345-371.
Ritchie RO, Koester KJ, Ionova S, Yao W, Lane NE, Ager JW, 3rd. 2008. Measurement of the toughness of bone: a tutorial with special reference to small animal studies. Bone 43:798-812.
Rubin CT, Lanyon LE. 1984. Regulation of bone formation by applied dynamic loads. J Bone Joint Surg Am 66:397-402.
Rubin CT, Lanyon LE. 1985. Regulation of bone mass by mechanical strain magnitude. Calcif Tissue Int 37:411-417.
Ruff CB, Hayes WC. 1983. Cross-sectional geometry of Pecos Pueblo femora and tibiae–A biomechanical investigation: I. Method and general patterns of variation. Am. J. Phys. Anthrop. 60:359-381.
Schaffler MB, Burr DB, Jungers WL, Ruff CB. 1985. Structural and mechanical indicators of limb specialization in primates. Folia Primatol Basel:61-75.
Skedros JG. 2012. Interpreting load history in limb-bone diaphyses: Important considerations and their biomechanical foundations. In: Crowder C, Stout S, editors. Bone Histology: An Anthropological Perspective: CRC Press. p 153-220.
Skedros JG, Dayton MR, Sybrowsky CL, Bloebaum RD, Bachus K. 2006a. The influence of collagen fiber orientation and other histocompositional characteristics on the mechanical properties of equine cortical bone. J Exp Biol 209:3025-3042.
Skedros JG, Keenan KE, Cooper DM, Bloebaum RD. 2014. Histocompositional organization and toughening mechanisms in antler. J Struct Biol 187:129-148.
Skedros JG, Keenan KE, Williams TJ, Kiser CJ. 2013. Secondary osteon size and collagen/lamellar organization (“osteon morphotypes”) are not coupled, but potentially adapt independently for local strain mode or magnitude. Journal of Structural Biology 181:95-107.
Skedros JG, Mendenhall SD, Kiser CJ, Winet H. 2009. Interpreting cortical bone adaptation and load history by quantifying osteon morphotypes in circularly polarized light images. Bone 44:392-403.
Skedros JG, Sorenson SM, Hunt KJ, Holyoak JD. 2007. Ontogenetic structural and material variations in ovine calcanei: a model for interpreting bone adaptation. Anat Rec 290:284-300.
Skedros JG, Sorenson SM, Takano Y, Turner CH. 2006b. Dissociation of mineral and collagen orientations may differentially adapt compact bone for regional loading environments: Results from acoustic velocity measurements in deer calcanei. Bone 39:143-151.
Starck JM, Chinsamy A. 2002. Bone microstructure and developmental plasticity in birds and other dinosaurs. J Morphol 254:232-246.
Turner CH, Burr DB. 1993. Basic biomechanical measurements of bone: A tutorial. Bone 14:595-608.
van der Meulen MC, Jepsen KJ, Mikic B. 2001. Understanding bone strength: Size isn’t everything. Bone 29:101-104.
Vashishth D. 2004. Rising crack-growth-resistance behavior in cortical bone: implications for toughness measurements. J Biomech 37:943-946.
Williams T, Jardine C, Keenan K, Skedros J, Kiser C. 2010. Secondary osteon cross-sectional size and morphotype score are independent in limb bones subject to habitual bending or torsion. Am J Phys Anthropol Supplement 50:245.
Zioupos P, Currey JD. 1998. Changes in the stiffness, strength, and toughness of human cortical bone with age. Bone 22:57-66.