
Using the stress-strain curve for considering mechanisms of bone adaptation produced by remodeling-induced affects on CFO, osteon morphotypes, and osteon population densities
What follows is an exercise that considers how primary modifications for pre-yield (elastic) behavior can secondarily have beneficial consequences for post-yield behavior. This exercise helps to clarify why regional patterns of CFO and/or osteon morphotypes have cardinal importance for interpreting load history.
Consider this question: How does a bone achieve enhancements to its post-yield material properties when it would seem that natural selection would be at work in the pre-yield portion of the stress-strain curve (where bone tissue usually exists with regard to pre-fracture deformation throughout the course of an animal’s life)? Another way to think about this is to ask: How can material adjustments that appear to be aimed at enhancing behavior in the pre-yield portion of the stress-strain curve also improve post-yield behavior (Fig. 1A)? Can this be accomplished through quasi independent natural selection for pre-yield vs. post-yield behavior, or is post-yield behavior simply a consequence of the inherent material properties of bone (which seems to be the case in deer antler where secondary osteons are scarce (Krauss et al., 2009, Skedros et al., 2014)?
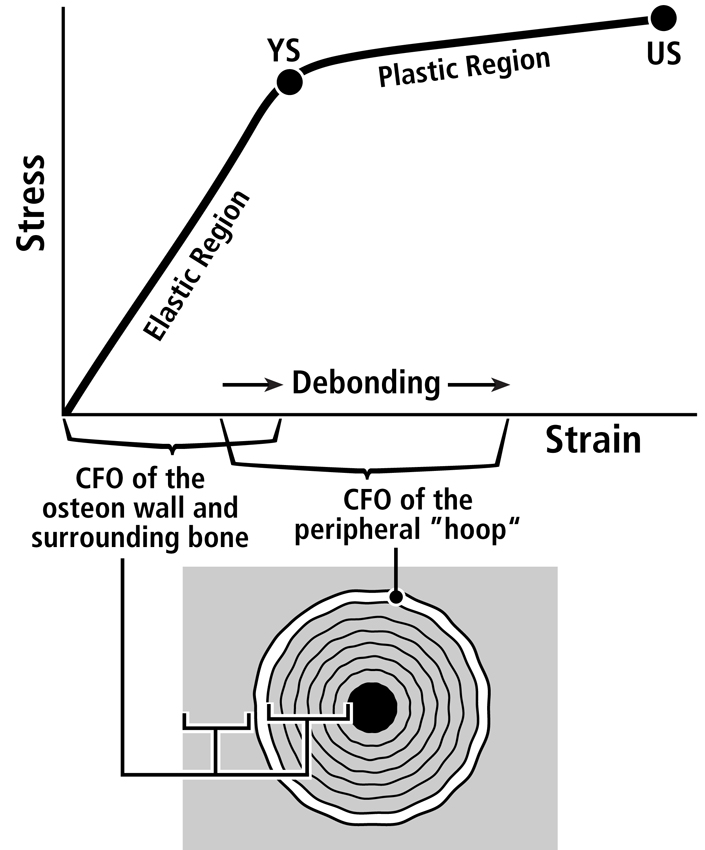
Fig. 1 A. Stress-strain curve of a tension test that shows the hypothesis that the longitudinal collagen that forms the majority of the wall in “tension” osteons helps to satisfy the material requirements of the bone-mineral composite for elastic behavior by curbing excessive strains in order to avoid irreversible damage. The oblique-to-transverse collagen fiber orientation (CFO) of the peripheral lamellae (“hoops”) of these osteons (see Figs. 7.11 and 7.12) allow for debonding at the cement line in a quasi controlled fashion as the yield point (YS) is approached, and this can continue beyond this point into the initial portion of the plastic region (between YS and US). This “beneficial” debonding dissipates energy that helps to avoid reaching the US point where fracture then occurs. This depiction is based on data and observations described by Bigley et al. (2006), Martin et al. (1998) and Williams et al. (2010).
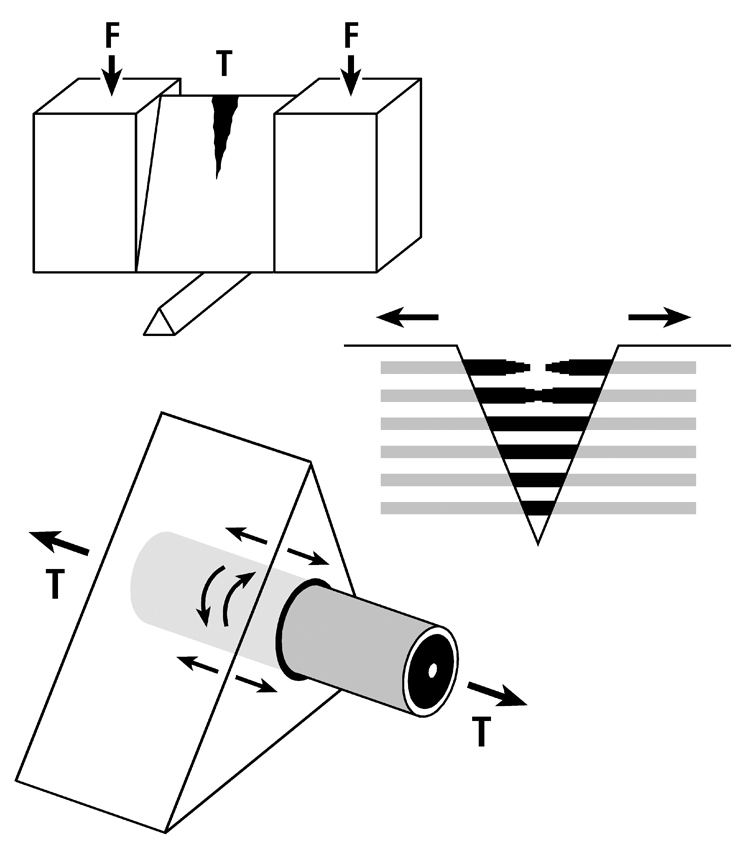
Fig. 1 B. Three drawings depicting an energy absorption (toughness) test in tension (T) of a machined specimen (at top) loaded at each end with a force (F). Energy is absorbed as the osteons debond, pullout, and bridge the forming crack (middle drawing). Osteon morphotypes (see section 7.6) that appear to be adapted to accommodate habitual tension and resist tension overload have a peripheral lamella with highly oblique/transverse collagen (“hoop”) that probably also absorbs energy by resisting shear stresses (curved lines in lower drawing) during debonding and pull out. (Adapted from Martin et al. (1998), figure 5.14, pg. 203.)
Three important facts that help to answer these questions are: (1) remodeling can be activated by bone microdamage that naturally occurs in the pre-yield phase (Reilly, 2000) (tough materials allow some microdamage formation as long as these microdamage entities do not propagate much), (2) remodeling can probably be activated by strains that are greatly amplified at the osteocyte level but may not have caused classical microdamage (e.g., microcracks), and (3) osteonal interfacial debonding (e.g., at the cement line) can be a “good thing” because it allows for the dissipation of energy, which helps to avoid ultimate failure (Hiller et al., 2003, Bigley et al., 2006, Reilly et al., 1997) (Fig. 1B). Adaptations that enhance the bone tissue performance that are triggered by microdamage (an “extra-genetic” factor, Fig. 2 and are most readily subject to natural selection, can include the formation of strain-mode-specific osteon morphotypes and/or modeling-mediated adjustments in bone nanostructure/microstructure (e.g., interfaces and bonding characteristics associated with patterns of predominant CFO, and/or patterns of vascular anatomy and their associated histological interfaces). This is discussed further in Skedros (2012). These can be thought of as “primary adaptations”; namely, those that are primarily aimed at enhancing pre-yield behavior. These primary adaptations can have beneficial (perhaps serendipitous) effects for post-yield behavior. In turn, even though the plastic phase is not often experienced, the possibility that strains would become high enough to enter this phase must be anticipated (or “pre-adapted”) so that failure is not rapidly catastrophic. From this perspective, it is plausible that the differences in “tension” osteon morphotypes (e.g., the degree of the completeness of the peripheral bright “hoop”) (Figs. 3 and 4) could help enhance ‘beneficial’ debonding when post-yield strains are experienced. By contrast, the majority of the wall of “tension” osteon morphotypes (i.e., the longitudinal collagen fibers) accommodates the requirements for pre-yield behavior, which is where the usual/typical loading occurs (Fig. 1). Osteon size might also play a role in this context (Bigley et al., 2006, Hiller et al., 2003), but this is not linked to osteon morphotype (e.g., larger osteons having brighter and more complete peripheral “hoops”)(Skedros et al., 2013). This coupled pre-yield/post-yield adaptation hypothesis warrants further investigation in order to better understand how a bone’s nanostructural and microstructural properties contribute to its toughness across the pre-yield/post-yield transition (Williams et al., 2010).
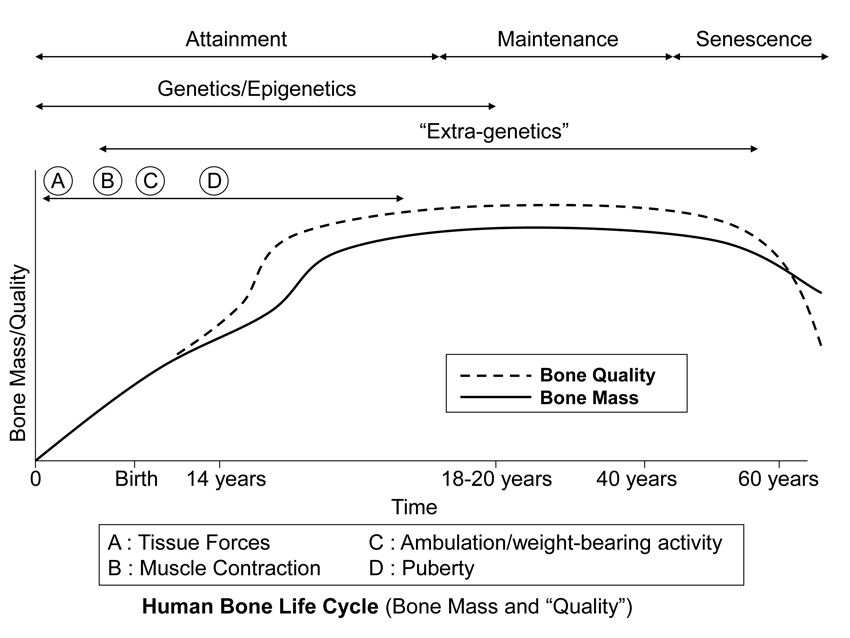
Fig. 2 This stylized depiction of ontogenetic changes in bone mass and “quality” (e.g., bone tissue mechanical properties) in humans and is adapted from several sources (Biewener and Bertram 1993; Carter and Beaupré 2001; Kassem et al. 1996). This figure helps to conceptualize the putative shifts in the temporal importance of genetic, epigenetic, and extra-genetic influences, especially with respect to varying histocompositional characteristics within or between bones. In this context, for example, the regional material variations that emerge in the “tension” and “compression” cortices during mid-to-late phases of growth of horse radii (Riggs et al. 1993) and sheep calcanei (Fig. 7.25) may serve to enhance the toughness and fatigue resistance for these habitual non-uniform strain environments. From the pre-natal phase and well into the attainment phase, the adaptive growth response of cartilage, or chondral modeling (not discussed in this chapter), has a profound influence on the growth and form of limb bones, especially at their epiphyses where articulations are formed with adjacent bones (Hammond et al. 2010). Shown is also the second bone mass growth spurt that occurs in humans, which has not been demonstrated in any other amniote.

Fig. 3 The six-point scoring scheme with examples of each osteon birefringence pattern (osteon “morphotype”). These images are reproduced from the original study of Martin et al. (1996b). The numerical values of each of the six morphotypes are used to calculate the osteon morphotype score (MTS) of entire microscopic images that contain many osteons (Skedros et al. 2009). Four of the six numerical scores shown include consideration of the completeness and birefringence strength (brightness) of the peripheral ring “O” or hoop:
0 = category N, a dark osteon with no birefringent lamellae;
1 = category OWI, a combination of OI and OW;
2 = category OW, similar to O but the birefringent ring is weak (W);
3 = category OI, similar to O but the birefringent peripheral ring is incomplete (I);
4 = category O osteon with dark interior and strongly birefringent peripheral lamellae;
5 = category D, birefringent lamellae are distributed throughout the wall of the osteon (“distributed” osteon group). This group includes “bright” osteons (less frequent) and “alternating” osteons (more frequent).
(Images are reproduced from Martin et al. (1996a) with permission of Elsevier Science, Inc.)
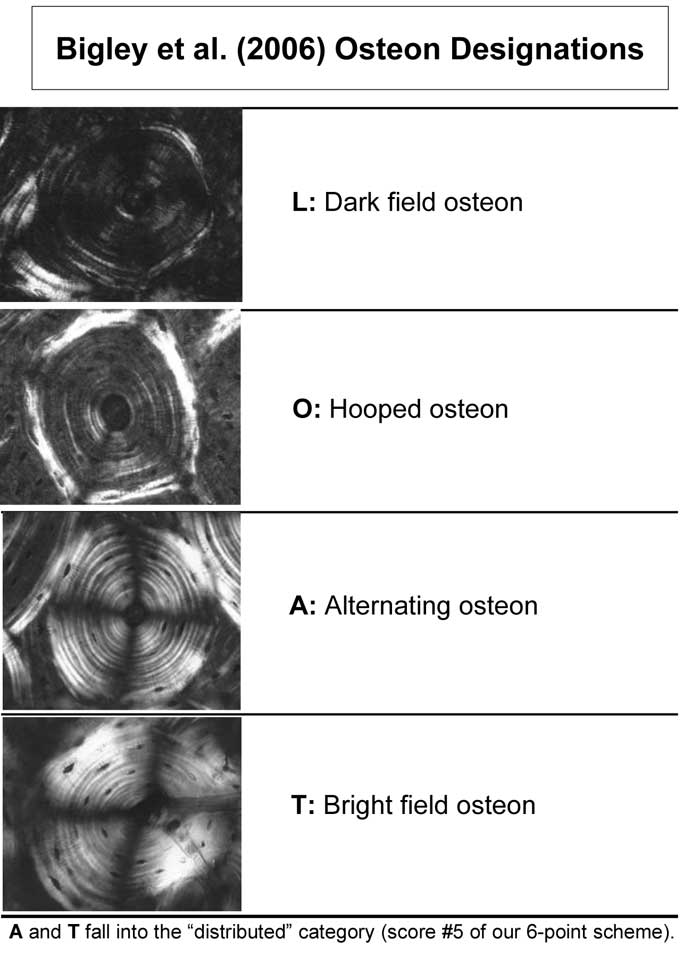
Fig. 4 Examples of the osteon morphotypes that were analyzed in pushout tests by Bigley et al. (2006).
(Images are reproduced with permission granted by Lanny Griffin and Elsevier Ltd., Oxford, UK.)
The biomechanical concepts highlighted by this exercise provide the insights into how and why osteon morphotypes and/or predominant CFO might be subject to natural selection even though post-yield strains would be expected to be uncommon events.
References
Biewener AA, Bertram JEA (1993) Mechanical loading and bone growth in vivo. In Bone, Volume 7, Bone Growth – B (ed Hall BK), pp. 1-36. Boca Raton, FL: CRC Press.
Bigley RF, Griffin LV, Christensen L, Vandenbosch R (2006) Osteonal interfacial strength and histomorphometry of equine cortical bone. J Biomech, 39, 1629-1640.
Carter DH, Beaupré GS (2001) Skeletal function and form. Mechanobiology of skeletal development, aging, and regeneration, University of Cambridge, Cambridge, UK.
Hammond AS, Ning J, Ward CV, Ravosa MJ (2010) Mammalian limb loading and chondral modeling during ontogeny. Anat Rec (Hoboken), 293, 658-70.
Hiller LP, Stover SM, Gibson VA, et al. (2003) Osteon pullout in the equine third metacarpal bone: Effects of ex vivo fatigue. J Orthop Res, 21, 481-488.
Kassem M, Melton LJ, Riggs BL (1996) The Type I Type II mode for involutional osteoporosis. In Osteoporosis (eds Marcus R, Feldman D, Kelsay J), pp. 691-702. New York: Academic Press.
Krauss S, Fratzl P, Seto J, et al. (2009) Inhomogeneous fibril stretching in antler starts after macroscopic yielding: indication for a nanoscale toughening mechanism. Bone, 44, 1105-10.
Martin RB, Gibson VA, Stover SM, Gibeling JC, Griffin LV (1996a) Osteon structure in the equine third metacarpus. Bone, 19, 165-71.
Martin RB, Gibson VA, Stover SM, Gibeling JC, Griffin LV (1996b) Osteonal structure in the equine third metacarpus. Bone, 19, 165-71.
Reilly GC (2000) Observations of microdamage around osteocyte lacunae in bone. J. Biomech., 33, 1131-1134.
Reilly GC, Currey JD, Goodship AE (1997) Exercise of young thoroughbred horses increases impact strength of the third metacarpal bone. J Orthop Res, 15, 862-868.
Riggs CM, Lanyon LE, Boyde A (1993) Functional associations between collagen fibre orientation and locomotor strain direction in cortical bone of the equine radius. Anat Embryol, 187, 231-238.
Skedros JG (2012) Interpreting load history in limb-bone diaphyses: Important considerations and their biomechanical foundations. In Bone Histology: An Anthropological Perspective (eds Crowder C, Stout S), pp. 153-220. CRC Press.
Skedros JG, Keenan KE, Cooper DM, Bloebaum RD (2014) Histocompositional organization and toughening mechanisms in antler. J Struct Biol, 187, 129-48.
Skedros JG, Keenan KE, Williams TJ, Kiser CJ (2013) Secondary osteon size and collagen/lamellar organization (“osteon morphotypes”) are not coupled, but potentially adapt independently for local strain mode or magnitude. Journal of Structural Biology, 181, 95-107.
Skedros JG, Mendenhall SD, Kiser CJ, Winet H (2009) Interpreting cortical bone adaptation and load history by quantifying osteon morphotypes in circularly polarized light images. Bone, 44, 392-403.
Williams T, Jardine C, Keenan K, Skedros J, Kiser C (2010) Secondary osteon cross-sectional size and morphotype score are independent in limb bones subject to habitual bending or torsion. Am J Phys Anthropol, Supplement 50, 245.